Shiny App Tutorial
All resources from this project are credited. Please contact me if you have any questions.
1. Download R Studio
Note: Downloading R can be tricky. Most of the time users code in R Studio, found your version here!.
2. Open R Studio and a New R Script
3. Find the console and type in the following code:
install.packages("shiny")
Note: The console is located in the lower left hand side of your screen. There, you can install the Shiny package.
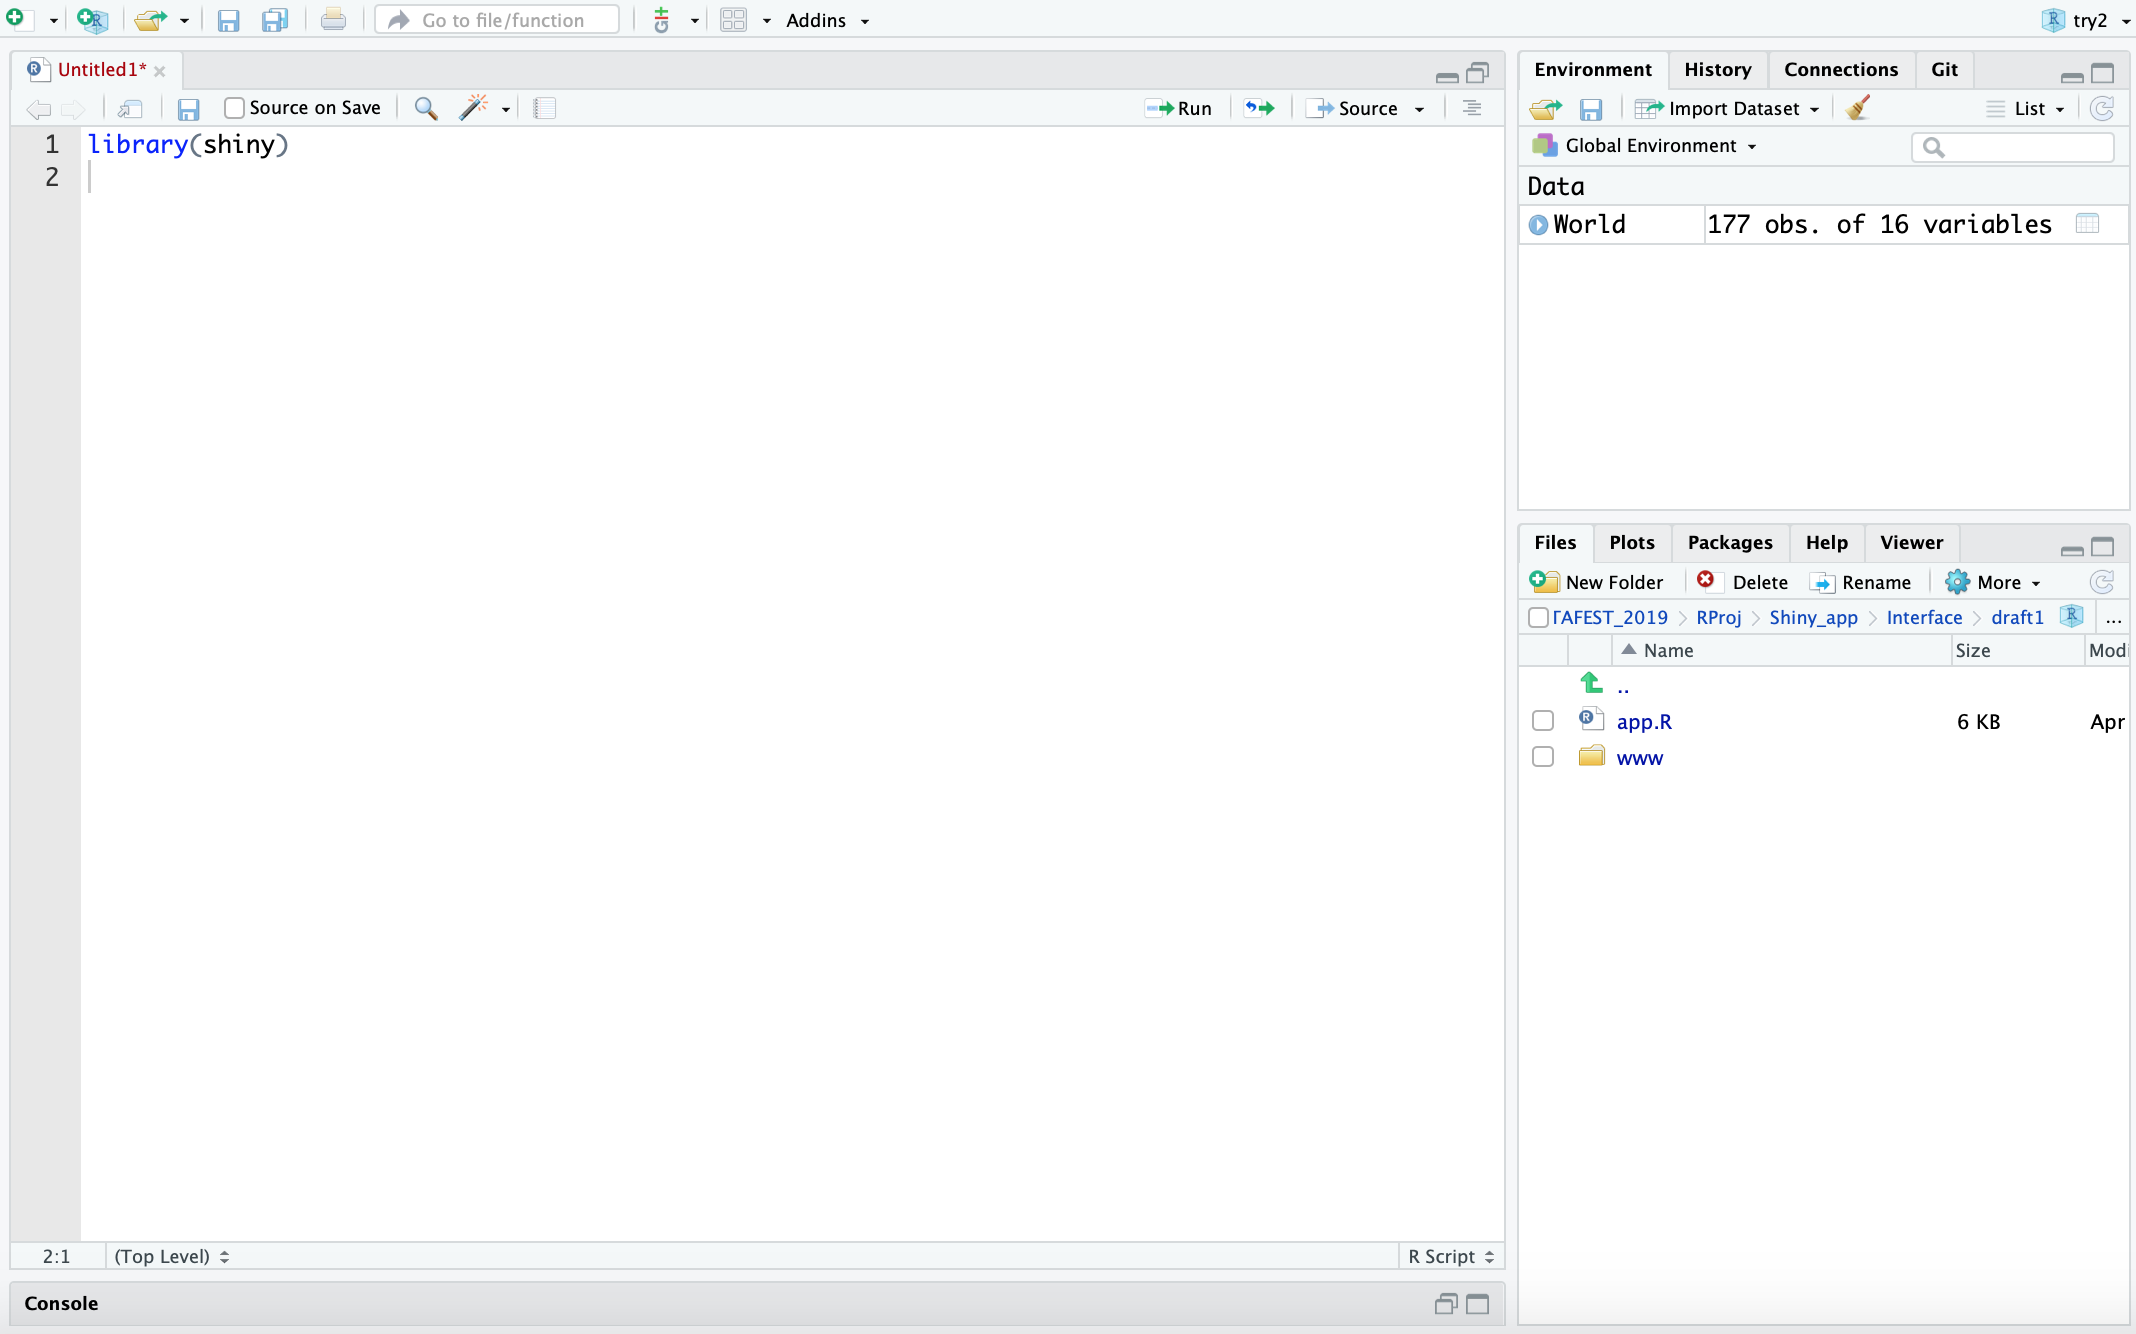
4. Type in the following in the empty R script:
library(shiny)
Note: Remember that you must call a package after you install it.
You can do a lot with Shiny. An example of Shiny code can be found here.
5. Import dataset
Sample code:
read.table("where_you_store_your_data")
read.xlsx("where_you_store_your_data")
Other ways to import data
Note: The dataset I used in this project is from Datafest 2019.
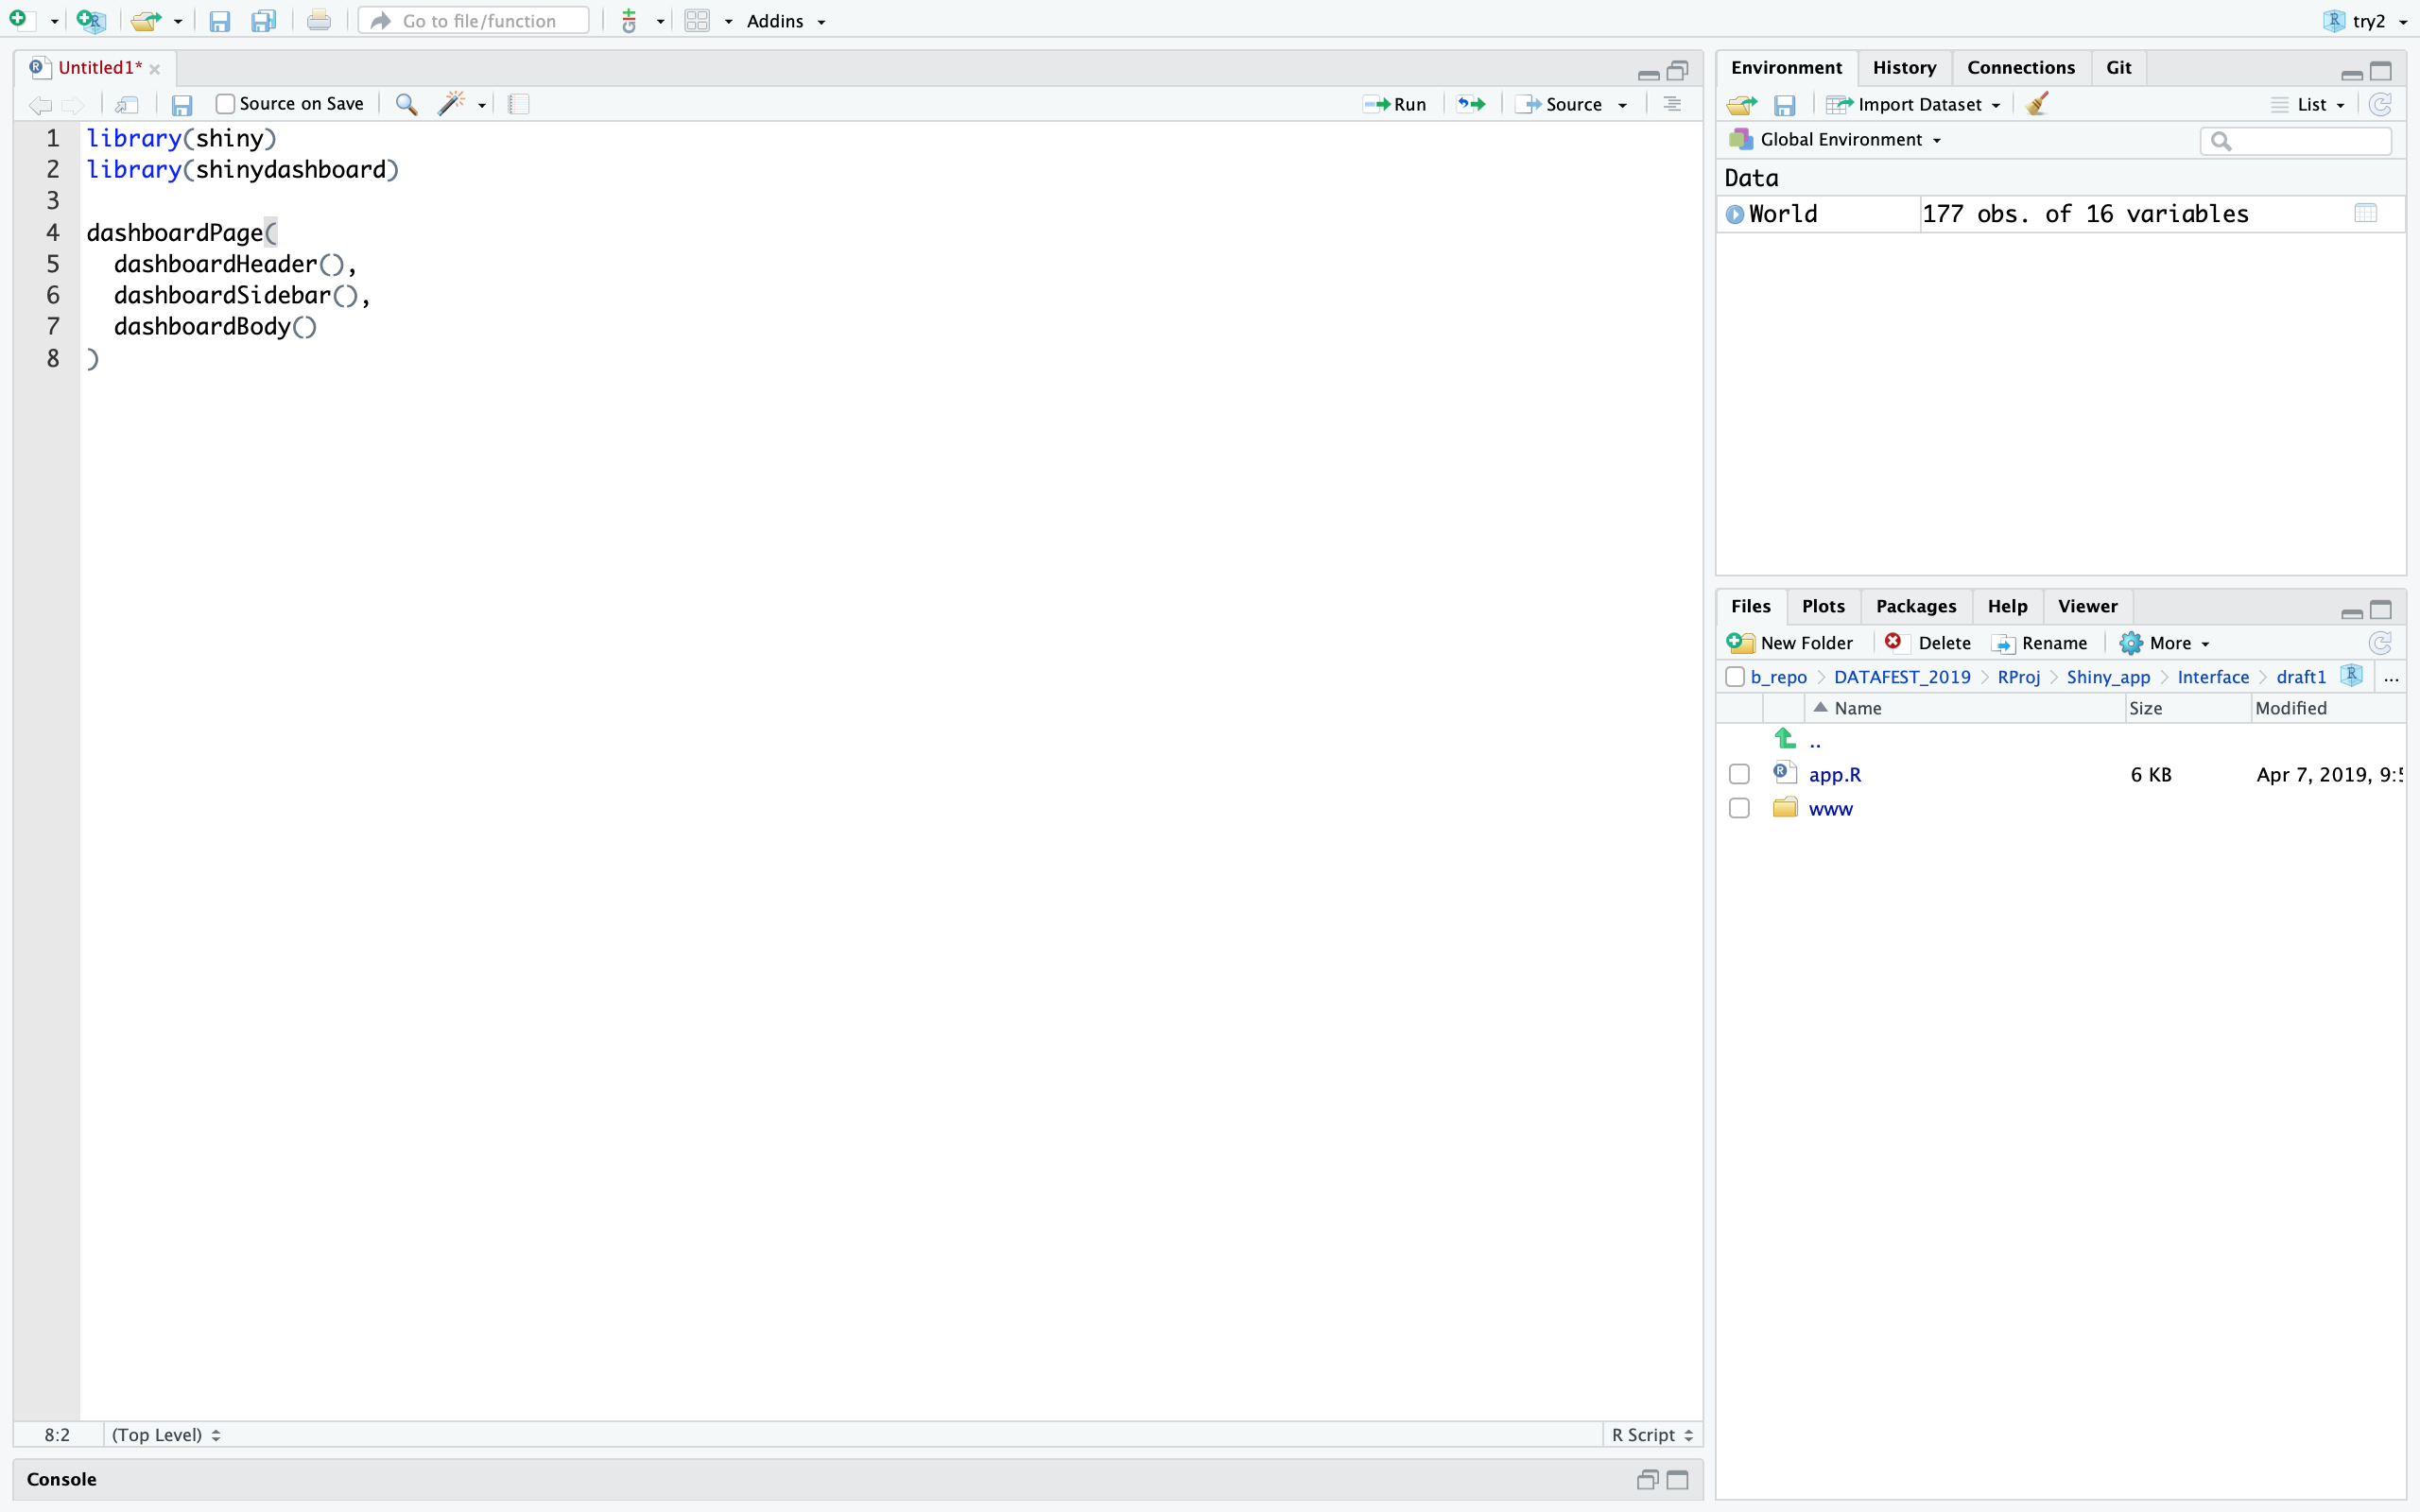
6. Install shinydashboard
install.packages("shinydashboard")


        library(shinydashboard)
You can find more information on Shiny Dashboard
Then, type in the following:
7. Introduce Leaflet in R
Leaflet is a popular JavaScript library for interactive maps. More information can be found here.
install.packages("leaflet")


        library(leaflet)
Note:Leaflet also allows add-on features(e.g. addTiles, addMarkers, and addPolygons).
Oue Result:
At Datafest 2019, my team competed in the final round with around 20 teams and won the Best Visualization Award (the second year in a row!).
Check out our presentation!
Other things you can do with Shiny:
- d3: my personal favorite, try
library(d3heatmap) - Google Charts
- plotly.js
- A Comprehensive List of Other Cool Stuff